In the business development world, one sales metric dominates all the others by order of magnitude – the price associated with a qualified sales appointment. That figure helps you to understand crucial components of the top-funnel sales generation activities and design a realistic map of the sales activation journey.
Cost Per Lead is a foundation for all Business Development Representatives (BDRs) quotas and the outcome sales and marketing managers focus on. By knowing what is required to generate a single Sales Qualified Lead (SQL), you can determine the number of monthly meetings needed and understand what real success for your business looks like.
CPL generates a lot of interest around its calculations, yet there is an absence of information, analysis and writing about what an average Cost Per Lead Formula should be.
Not until now.

In this example, we will look at hidden and apparent costs associated with a qualified meeting, averaging the numbers across industries, company sizes and Australian geographies to get an overall sense of expectations.
Building an outbound sales generation team
Building an inside sales organisation wasn’t for the faint of heart even before the pandemic. As of writing today, there are more than 16,000 available BDR vacancies Australia-wide on seek.com.au, and the demand keeps growing.
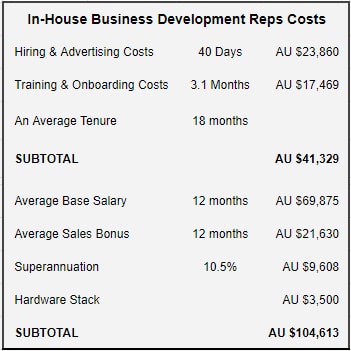
According to HR Industry Benchmark Report conducted by ELMO Software and the Australian Human Resources Institute (AHRI) in March 2022, it takes an average of 40 days in Australia and 50 days in New Zealand to fill a position vacancy. The costs have gone to an average of $23,860 per candidate, up from $10,500 the previous year.
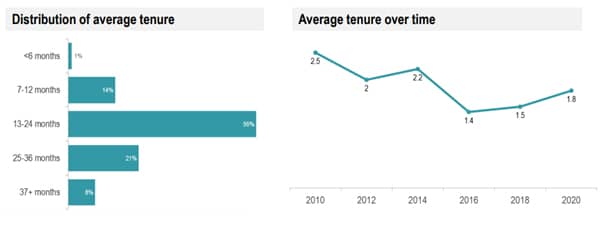
The 2021 SDR metrics Report conducted by The Bridge Group identified that an average new SDR/BDR ramp time to full productivity sits at 3,1 months with an average tenure of 1,6 years. By subtracting the ramp time from tenure, a median productivity time sits at 17 months.6
According to Glassdoor research based on 199 salaries, the estimated total pay for an Australian BDR is AU$91,505 per year with a distribution of AU$69,875 base and an AU$21,630 bonus structure.
These are just some costs that go into the Cost Per Lead calculator.
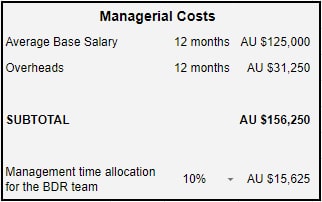
Another critical factor that is often overlooked in the CPL calculations is the oversight time required for the ongoing support and management process of the BDR team. The managerial costs can vary depending on the inside sales structure of your organisation and the headcount of your team. To keep the costs minimal in our calculations example, we will allocate only 10% of the managerial time to ensure on-time sales goal attainment and lower employee attrition. In a real-life scenario, this number most likely be higher.
Glassdoor is here again to help us determine an average Sales Development Manager salary in Australia: AU$125,000 Base and AU$54,075 remuneration.
For our calculations only, we will leave a bonus compensation aside, though we will add an industry-standard overhead of 25% comprising superannuation and other factors (software, hardware, etc.)
And that’s what we leave beyond these calculations.
Lead generation is one of the most tedious and time-consuming jobs in the business development process. It is flooded with rejections and requires advanced training and self-discipline to maintain focus on goals. That is why OTE (On-Target Earnings) becomes so important to keep BDR motivated and engaged in the face of daily challenges.
The BDR role is often seen as a training ground for other sales roles, and that is why it is not surprising the average tenure factor of 18 months is outlined in The Bridge Group report. However, the average productive capacity of mere 15 months creates enormous pressure on hiring managers to get things right.
Cost per lead calculations
When we are armed with the annual BDR costs calculations, we need to understand the average quotas to get the CPL.
The 2021 SDR Metrics Report by The Bridge Group comes to our rescue again. It breaks down the quotas into two categories:
- Introductory Meetings (aka Sales Accepted Leads or SAL) = 15
- Qualified Opportunities (aka Sales Qualified Leads or SQL) = 7.5
The difference between these two figures is massive, and it highly differs from a similar report created in 2018 with a ratio of 11/10. It shows a higher number of meeting bookings with a much lower conversion rate to a real opportunity.
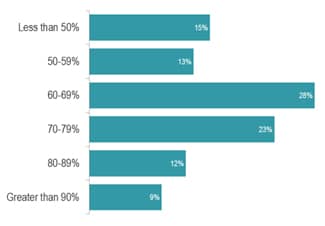
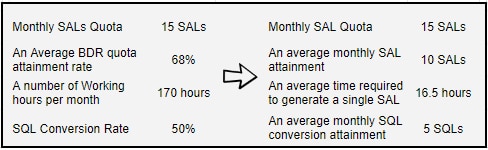
On the other hand, Quota Attainment by reps has been remarkably consistent over the years, demonstrating an average of 68% BDRs achieving quota in a given group.
With an average of 15 SALs per 170 working hours in a month and an SQL conversion rate of 50%, we are getting to the following figures.
These calculations transcribe into an average of 120 SALs and 60 SQLs per year. From our practice experience, this number feels about right working across industries and sectors with different B2B target audiences, methods of outreach and value propositions.
And Finally: An average Cost Per Lead in AUD.
So when we add up the In-house BDR costs, the costs required to onboard and train a new employee, plus the managerial effort, and then split what we’ve got into 12 months, we come up with the following average BDR monthly costs:
((AU $41,329 / 18 x 12)+AU $111,113 + AU $15,625) / 12 = AU $12,858
And here are the average costs per sales accepted and qualified leads:
SAL = AU $1,285
SQL = AU $2,571
So here we are. The realistic cost of a Sales Qualified Opportunity for most companies in a B2B space is AU$2,571.
Your situation might be different, as too many factors are involved in the process. For example, your average lead generation time might be faster, your in-house BDR team might be above average, and your initial lead qualification process is flawless. Regardless of one’s previous experience, none of the figures above is grossly exaggerated to either an expensive or a cheap end.
So if now someone asks you what your price per lead is, you could walk through these calculations and respond with a representative answer. Another advantage of knowing the averages is understanding how you might beat the market and reduce new business acquisition costs.
BIASSED COMMENT: Salary, overhead, and management are the most significant contributors to the cost increase. And since you are reading this article on the ILLICIUM blog, it is time to mention that sales augmentation is what we do. We help clients to generate qualified opportunities in an optimised way. Often at a fraction of their average industry cost. To learn how, click on the button below to book a quick discovery meeting with the friendly team.
Illustration: Designed by Freepic